Many asset managers and maintenance managers like benchmarking as it allows them to compare themselves with peers in the industry. More importantly, it offers a way to assess how well their department and business are doing and how much it will have to improve to reach targets. Asset performance management (APM) and maintenance have many well-known and well-used benchmarks to evaluate the state of asset performance and to unlock improvement potential. However, the catch is that a bare number does not hold much value without a business context. MaxGrip consultants Ernstjan Meinen and Justin Satink share four asset performance benchmark examples and explain with site assessment examples how context influences results.
If you want to improve the performance of your assets and lower Total Cost of Ownership, it is essential to go beyond maintenance and look at more connected dimensions within an organization. Therefore, at MaxGrip we assess fourteen APM competences belonging to one of three dimensions: management, asset reliability and maintenance execution. In our 25 years experience in Asset Performance Management and maintenance we know that this gives a full and balanced picture of the current APM maturity level and state of a plant. Our extensive database of projects around the world serves as the baseline for the discussed asset performance benchmark.
Management Benchmark: TMC/ARV Ratio
To show the value of business context from a management perspective, we will discuss a benchmark in the area of budget & cost control, namely Total Maintenance Cost (TMC) as a percentage of the Asset Replacement Value (ARV). Total Maintenance Cost are the annual cost of maintaining a site or plant including investment costs, so CAPEX related to maintenance. Asset Replacement Value can be defined as the budget needed to completely replace the production capability of the plant. Commonly, the TMC/ ARV benchmark is set at 3,5%. However, your true desired percentage for this benchmark should also be determined by taking the assets’ age and complexity into consideration.
Let’s show this with two examples of plants we did an AIM, a current state assessment, for.
The pink mark represents a plant that is twenty years old. They are spot on for the TMC/ ARV benchmark with a healthy 3,2%. So, they seem to invest the correct budget to not build up a backlog in asset condition (CAPEX and OPEX). However, when looking more closely and visiting the plant we discovered that the plant already had a considerable backlog in asset condition for critical equipment. With their 3,2% ratio they should actually invest more to avoid a growing backlog problem.
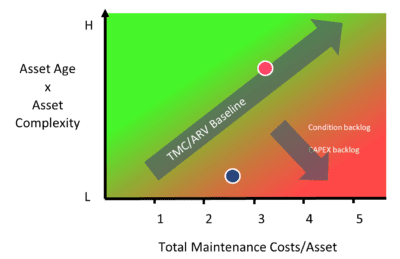
The blue mark represents a site that is only two years old. Although a TMC/ ARV ratio of 2,5% is regarded good by industry standards, they are in the red in our chart. With the young age of the plant this site cannot have a backlog in asset condition. However, we found out that they are spending too much on maintenance and are therefore overmaintaining.
Asset Reliability Benchmark: PM/CM Ratio
The benchmark for Preventive Maintenance (PM) versus Corrective Maintenance (CM) ratio is often used and best practice is usually set at 70-30%. Again business context or differences in definitions can influence that number.
We again use some site assessment examples to emphasize the importance of contextualization.
In the first case you see a production location of an asset intensive multinational which reported a 66-33% PM/CM ratio. However, MaxGrip came to a completely different percentage with 24-76% PM/CM ratio. This was due to a different interpretation of what Preventative Maintenance is.
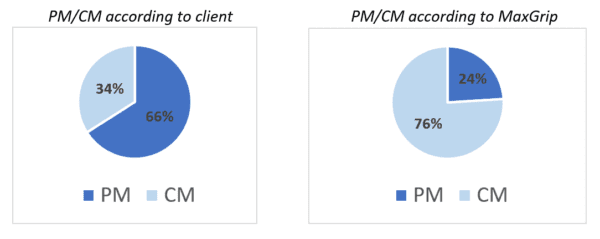
At the site Preventive Maintenance was defined as all plannable maintenance done before a failure has occurred or a problem has been detected. At MaxGrip we use a narrower definition as in our interpretation PM tasks only originate from a defined and documented maintenance strategy.
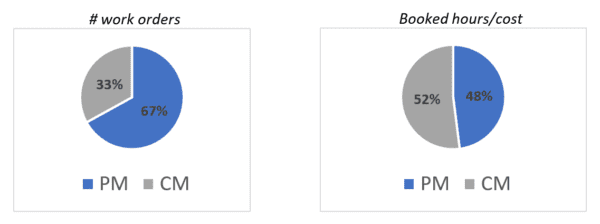
Our second current state assessment example shows a difference in how to count a task as PM or CM.
Maintenance Execution Benchmarks: Plannable Maintenance and Schedule Adherence
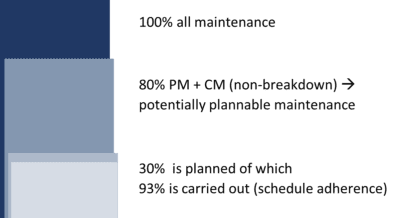
For the execution of maintenance two connected benchmarks in the area of planning and scheduling are interesting to discuss together. The best practice for potentially plannable maintenance is over 70%. When doing a current state assessment at a site, we look critically at whether maintenance is actually planned and what the planning window is. For the second asset performance benchmark of schedule adherence the best practice is set at 90%. When doing an assessment we look at the planning outlook, how realistic and feasible the schedule is (demand versus execution balance) and regard the existing backlog.
To give an example of how these two benchmarks interact look at the following: if we see that 80% of the work orders is potentially plannable maintenance combined with a 93% schedule adherence at first investigation then one could conclude that the assessed site is doing an excellent job and is easily reaching benchmark targets. However, when looking more closely we see that the plant has an 80% potentially plannable maintenance of which only 30% is actually planned and of those planned tasks only 93% are done. So, this plant has quite some improvement potential in this area.
Asset Performance Benchmark conclusion: Contextualize and Connect the Dots
Contextualization of findings is of the utmost importance when doing a current state assessment of an organization’s asset performance benchmark. The benchmarks as presented in this article are only a few examples and are part of their own context – an extensive framework which we call the Asset Improvement Program. When performing the first step of the framework the current state assessment called the Asset Improvement Mapping, we validate insights retrieved from data and information by interviewing stakeholders from a cross section of the organization. By synthesizing detailed findings about management, maintenance execution and asset reliability we are able to connect all of the dots and map improvement potential, always taking the uncovered factors of the business context into account. In our opinion, this thorough approach is the best way to come to a bespoke business case and a realistic roadmap to improving asset performance.
📊 Download free eBook on improving asset performance
📰 Continue Reading
- Article: Three Asset Management Challenges that Hold Back Asset Performance
- Energy company optimizes maintenance productivity and saves US$ 1.75 million annually
- Asset Improvement Mapping calculates over $270,000 in net savings in the first year
- Reliability Metrics 101: Mean Time Between Failure
- Asset Management: 7 Steps to Performance Improvement
Get inspired
An overview of MTTR, how to improve it, and how to use this knowledge to influence your organizations maintenance and reliability strategy.
More and more, we see companies acknowledge the crucial role that people play in getting successes by implementing Industry 4.0 solutions.
In asset management transformation, the Change Story is your guiding 'Northern Star,' aligning stakeholders and laying out the path for change. Integral to effective communication, it's viewed by MaxGrip as a prerequisite for sustainable success.
