Failure Mode and Effects Analysis (FMEA) is a methodology aimed at anticipating equipment failure by proactively identifying all potential failure modes of the various parts of a system. It identifies the effects a failure may have on the system and provides a maintenance strategy to avoid or mitigate the effects of said failure on the system.
Conversely, Root Cause Failure Analysis (RCFA) is the process for pinpointing the root cause(s) of a specific failure to decide what corrective action(s) must be implemented to alleviate or reduce the probability that the problem will recur due to the same root cause(s).
FMEA – Failure Modes and Effects Analysis
FMEA focuses on identifying failure modes existing within the structural design of an asset or system and how those failure modes affect operations.
A failure mode is the way a system, process, or piece of equipment can fail. The more complex the asset, the larger the number of failure modes. Often, this analysis will also assess the criticality of the risk associated with the failure modes through the use of Failure Mode Effects and Criticality Analysis (FMECA).
The difference between FMECA vs FMEA is that the FMEA incorporates criticality analysis with a more quantitative risk determination. In other words, it looks at the severity of the effect of each failure mode on the overall operation of the system.
The effects of failure can be expensive – a study by Aberdeen Research found that unplanned downtime in manufacturing processes can cost organizations up to $260,000 USD/hr. Therefore, the sooner a potential failure is uncovered, the less expensive it will cost to remedy the issue.
The benefit of FMEA is that it strives to identify all possible failure modes. By proactively discovering failures during development, FMEA offers lower costs solutions and more options for mitigating risk.
SAE J1739 provides a standard for FMEA and gives general guidance in the application of the methodology.

The Two Categories of FMEA
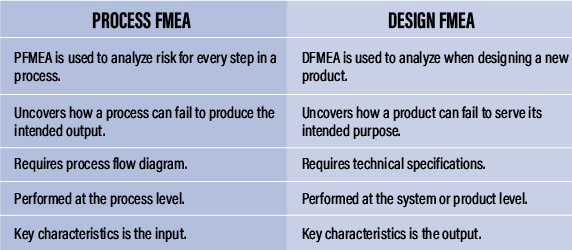
While similar in execution, PFMEA and DFMEA differ in their focus. While PFMEA focuses on process failures, DFMEA focuses on design failures. Below is a quick comparison between the two methodologies.

Design FMEA
Design FMEA (DFMEA) is the systematic approach used in product development to improve quality and reduce potential risks of failure. As new products are designed, or existing designs are modified, design failures can be unintentionally introduced. Using DFMEA, potential failures are identified early in the process. Detecting failures before production leads to significant cost savings compared to countermeasures in later design phases.
Process FMEA
Process FMEA (PFMEA) is the structured methodology used to discover potential failures within processes. Similar to DFMEA, PFMEA focuses instead on detecting failures caused by changes in a process as compared to a new or updated product design. A Process FMEA should be applied when:
- A new process or technology is launched
- A process is unchanged but introduced into a new operating environment
- A current process is modified or updated
How to perform FMEA
The FMEA process is performed step-by-step, with each consecutive step building on the previous. Below are the nine basic steps involved in FMEA.
Step 1: Define the process or function
The first stage identifies each process, part, or system to establish the intended function and the interrelationship between different subsystems or components.
Step 2: Brainstorm potential failure modes
The information gathered in step one is used to determine how the system or design could potentially fail. While failure modes can be part-specific, failures in one subsystem or component can affect and cause additional effects in other interconnected systems. That is why it is critical to create the asset hierarchy in step one and uncover all failure modes in step two.
Step 3: Identify each failure effect
Failure effects must be identified and listed for each failure mode. What are the environmental or safety consequences for a particular failure? Keep in mind a single failure mode can produce multiple failure effects.
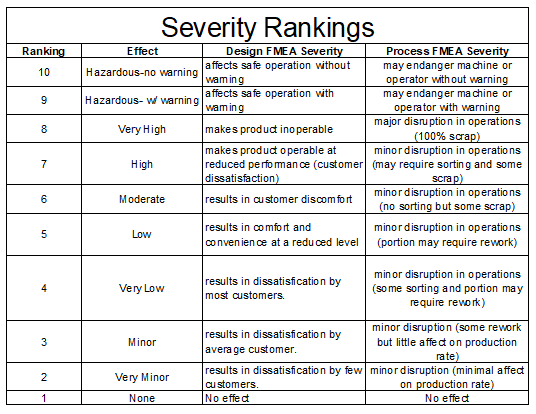
Step 4: Assign severity rankings
Next, failures are ranked based on the severity of the consequences. Failure impacts are ranked on a one through ten scale, with one being little to no effect and ten representing severe risk.

Step 5: Assign occurrence rankings
Similar to the severity ranking, the occurrence ranking also classifies failures on a one through ten scale. However, it rates the likelihood of failure rather than the severity of a failure’s effect.
A ranking of one represents a near-impossible likelihood while a ranking of ten signifies an extremely high probability.
Step 6: Assess and assign detection rankings
The detection ranking represents the chances a failure is discovered before occurring. Ratings of one rating mean an almost certainty that a failure is detected while a ten means the failure cannot be detected.
Step 7: Determine RPN
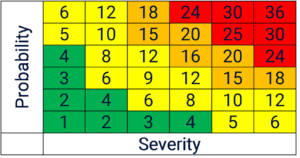
Determine RPN The Risk Priority Number (RPN) ranks risks from highest to lowest by combining the rankings for severity, occurrence, and detection. RPNs in FMEA help teams prioritize risks from most critical to least critical.
RPN = severity x occurrence x detection
Step 8: Determine action plan
Create an action plan for specific failures based on the highest calculated RPNs. Lower RPNs by targeting one or all the contributing factors: severity, occurrence, or detection. For example, implementing condition-based monitoring can improve failure detection, thus lowering the RPN.
Step 9: Re-evaluate RPN
Following corrective action, recalculate the RPNs and re-evaluate which failures to target.
When to use FMEA
FMEA should not be considered a standalone tool but instead be viewed as a systematic approach that provides a framework for identifying key issues related to product reliability and quality. FMEAs can be used at any time during a project’s life cycle, including concept development, design, manufacturing, testing, installation, maintenance, repair, and disposal.
RCFA – Root Cause Failure Analysis
Failure is inevitable, and when failure does occur, RCFA is the process for discovering the root cause(s) for said failure and using that information to create a corrective action plan. While there are many methods to assist with RCFA – Fishbone Diagram (Ishikawa Diagram), 5 Whys, Cause Map, Fault Tree Analysis – the process is generally the same.
The RCFA process
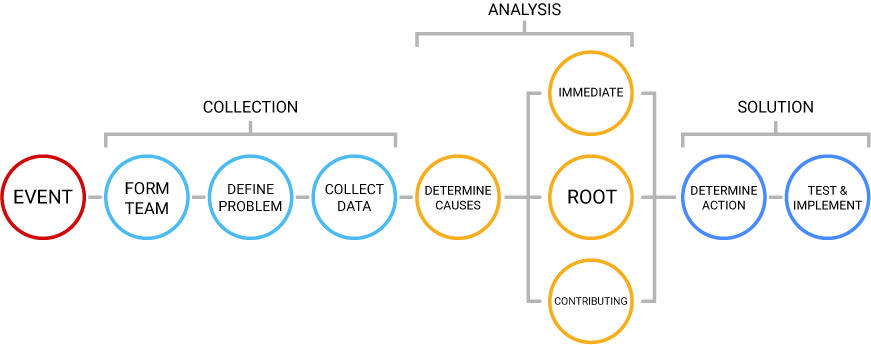
Typically, RCFA is divided into three distinct phases: collection, analysis, and solution.
Collection
The purpose of the collection phase is to form a team to investigate the failure, define the problem, and finally collect data from the incident. When defining the problem, it is important to keep it short and simple to understand. Overly complex or problem statements biased towards a specific solution can lead to insufficient resolutions. Finally, it is time for the actual data collection. Normally, data can come in the form of failed components, pictures and reports, or staff testimony.
Analysis
The analysis phase is focused exclusively on uncovering the failure cause and effect chain that ultimately leads to the root cause of failure. For more complex systems, use of the cause-and-effect methodology and a “fishbone” diagram are useful structures to integrate cross-functional impacts and see the overall picture of the failure. To avoid bias assumptions, an important guideline is to always follow the data.
Solution
Finally, it is time to formulate a solution. The solution phase attempts to break the cause-and-effect chain as determined in the analysis phase. Subsequently, the more developed the cause chain, the greater the capability to break the chain. Generally, solutions are corrective and/or preventive actions and are associated with the identified failure action and/or condition causes with corresponding effectiveness evaluations.

When to use RCFA
The most common time a failure analysis is employed is following a critical failure, which is why RCFA is often described as reactive. However, when used effectively, RCFA can be a proactive methodology to prevent future failures.
During equipment rebuild or disassembly following a malfunction, an initial RCFA cause map can provide useful data that would otherwise be missed. This data can be critical during the collection phase of a full RCFA. Additionally, it leads to insight on what caused the initial failure, possibly leading to corrective action before rebuilding that will avoid future unplanned failures.
Difference between RCFA and Root Cause Analysis (RCA)
The difference between RCFA and RCA is that RCFA focuses on finding the root cause of the failure whereas RCA focuses on identifying the contributing factors that led to the failure. Both processes include collecting data, analyzing the data to determine the root cause, and creating a remediation strategy.
RCFA typically has fewer steps than RCA because it relies heavily on the data collected during the collection phase. Therefore, it is recommended that you do not perform any additional testing to validate your findings. In addition, RCFA requires less resources than RCA because there is no need to recreate the conditions under which the failure occurred.
Conclusion: FMEA, RCFA and RCM
FMEA is an integral part of the Reliability Centered Maintenance (RCM) process because it helps classify failure modes and their effects, as described in SAE JA1011. After establishing failure modes, FMEA helps determine what maintenance strategies should be developed for its corresponding assets. Conversely, the RCFA process provides the opportunity to eliminate recurrent asset failures based on actual asset history analysis.
FMEA and RCFA assist an RCM methodology with both a proactive and reactive approach. While FMEA offers the benefit of reducing costs by discovering potential failure modes earlier in the process, RCFA provides increasingly accurate solutions with the use of historical failure data.
📰 Download free eBook – Four steps to improve your Root Cause Analysis program
Get inspired
Verdantix, an independent research and advisory firm, has designated MaxGrip as the innovator in the 2024 Green Quadrant for Industrial Asset Management Technology Implementation Services.
Middle managers are the driving force for effective change. We list three essential ingredients.


